
Understanding the calculations on your Performance Bond Rates
Access Bond Summary Window
To access your Bond Summary, you need to be on the Bid Sheet module of Estimating Link:
- You can click on the Markup Summary icon:
 which brings up the Markup Summary window. Then, click on the Bond icon:
  .
. - Or, click on View > MarkUp > Bond Table:

Your Bond Summary window will now be displayed:

Understanding the Bond Summary
The Bond Summary window displays four columns, two of which contain fields that you enter. Below is a description of each column:
| From* | Starting dollar amount |
| To | Ending dollar amount |
| Rate/M | Rate per $1,000. "M" represents 1,000 |
| Bond Amount* | Amount owed to the bonding company for that row's dollar amount range. |
*Estimating Link will automatically populate the fields marked with an asterisk(*).
We'll use the our sample project, Main St. to demonstrate the calculations for the Performance Bond Rate, starting with the first row. To the right of the Bond Summary window, we are showing the Total Bid (located on the Bid Sheet) for reference:
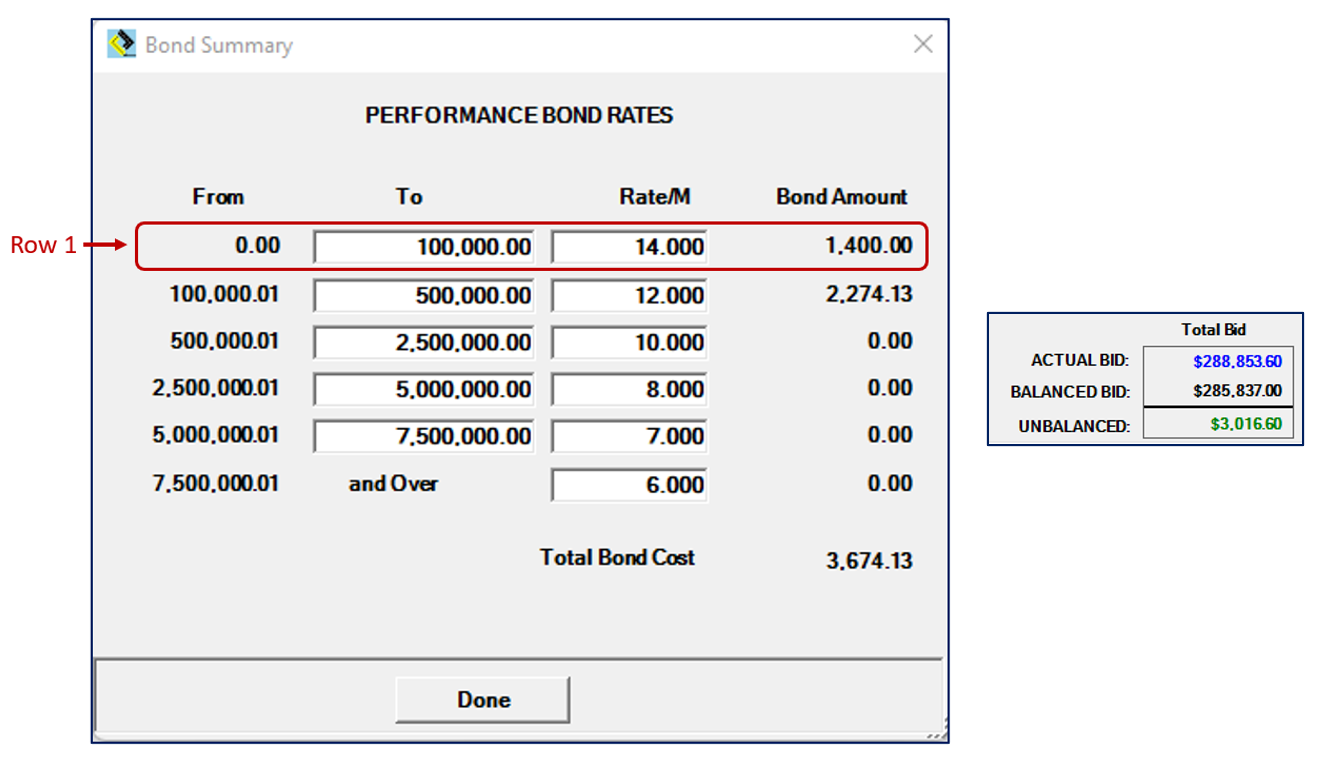
Row 1 is showing that from $0.00 to $100,000.00, my bond rate is $14 per thousand and my calculated Bond amount for this range is $1,400.
- $100,000/$1,000 = 100
- 100 x $14 = $1,400
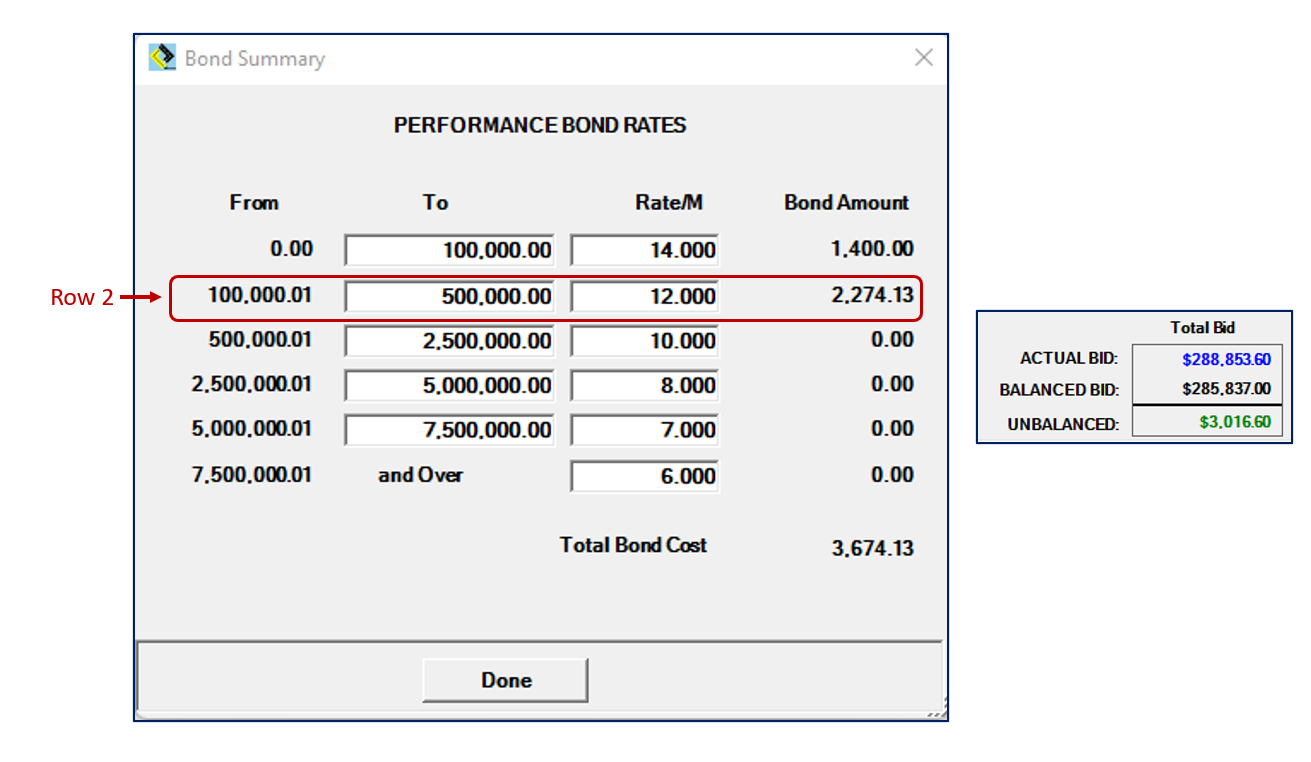
Row 2 is showing that from $100,000.01 to $500,000.00, my bond rate is $12 per thousand and my calculated Bond Amount for this range is $2,274.13.
My Balance Bid is $285,837.00
- 285,837.00 - 100,000 = 185,837.00
- 185,837/1,000 = 185.837
- 185.837 x 12 = 2,230.04
The Bond Amount is based on the sum of the Subtotal and Taxes - Add-on - Deduct and the Bond Amount itself, and is calculated by the rates entered on the Bonds screen. Overhead and profit are not added to the bond amount.